
Page 90 - Nanyang Technological University
P. 90
NOTES TO FINANCIAL STATEMENTS
(cont’d)
31 March 2016
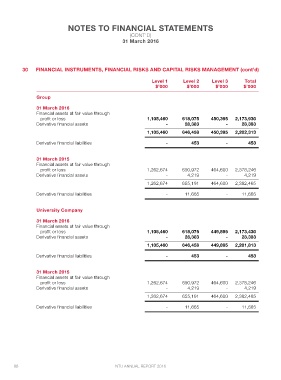
30 FINANCIAL INSTRUMENTS, FINANCIAL RISKS AND CAPITAL RISKS MANAGEMENT (cont’d)
Level 1 Level 2 Level 3 Total
$’000 $’000 $’000 $’000
Group
31 March 2016
Financial assets at fair value through
profit or loss 1,105,460 618,075 450,395 2,173,930
Derivative financial assets - 28,383 - 28,383
1,105,460 646,458 450,395 2,202,313
Derivative financial liabilities - 453 - 453
31 March 2015
Financial assets at fair value through
profit or loss 1,262,674 650,972 464,600 2,378,246
4,219 - 4,219
Derivative financial assets -
655,191 464,600 2,382,465
1,262,674
11,665
Derivative financial liabilities - - 11,665
University Company
31 March 2016
Financial assets at fair value through
profit or loss 1,105,460 618,075 449,895 2,173,430
Derivative financial assets - 28,383 - 28,383
1,105,460 646,458 449,895 2,201,813
Derivative financial liabilities - 453 - 453
31 March 2015
Financial assets at fair value through
profit or loss 1,262,674 650,972 464,600 2,378,246
4,219 - 4,219
Derivative financial assets -
655,191 464,600 2,382,465
1,262,674
11,665
Derivative financial liabilities - - 11,665
88 NTU ANNUAL REPORT 2016