
Page 87 - Nanyang Technological University
P. 87
NOTES TO FINANCIAL STATEMENTS
(cont’d)
31 March 2016
30 FINANCIAL INSTRUMENTS, FINANCIAL RISKS AND CAPITAL RISKS MANAGEMENT (cont’d)
Market risk - Price risk management
The Group is exposed to equity securities price risk from investments classified as financial assets at fair value
through profit or loss. The market values of these investments are affected by, amongst others, changes in market
prices as a result of changes in the global economic conditions, macro and micro economic factors affecting the
country where the investments are quoted, and factors specific to the investee corporations.
To manage the price risk arising from investment in equity securities, the Group diversifies its portfolio across
different markets and industries as appropriate.
Sensitivity analysis for price risk
If movements in financial markets result in a 5% (2015: 5%) appreciation/depreciation in the value of the quoted
equity and other investments, all other variables being held constant, the Group’s surplus would have been
higher/lower by $34,492,000 (2015: $42,218,000).
If movements in financial markets result in a 5% (2015: 5%) appreciation/depreciation in the value of the unquoted
investments, all other variables being held constant, the Group’s surplus would have been higher/lower by
$53,399,000 (2015: $55,779,000).
Foreign currency risk management
The Group’s investments which are managed by fund managers may be in instruments denominated in foreign
currencies. Currency exposure arising from such investments is managed by fund managers. Additional information
is set out in Note 10.
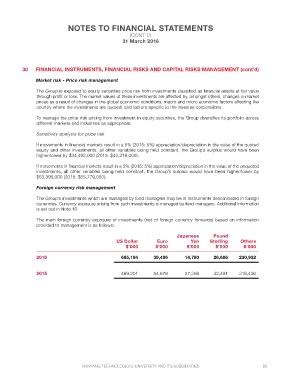
The main foreign currency exposure of investments (net of foreign currency forwards) based on information
provided to management is as follows:
Japanese Pound
US Dollar Euro Yen Sterling Others
$’000 $’000 $’000 $’000 $’000
2016 685,194 39,496 14,780 26,686 230,932
2015 469,201 54,676 27,366 42,491 316,436
NANYANG TECHNOLOGICAL UNIVERSITY AND ITS SUBSIDIARIES 85