
Page 91 - Nanyang Technological University
P. 91
NOTES TO FINANCIAL STATEMENTS
(cont’d)
31 March 2016
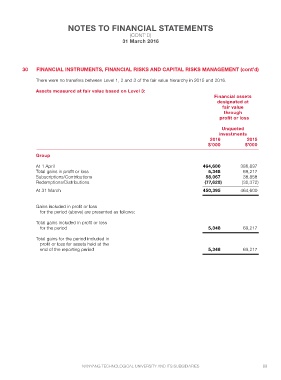
30 FINANCIAL INSTRUMENTS, FINANCIAL RISKS AND CAPITAL RISKS MANAGEMENT (cont’d)
There were no transfers between Level 1, 2 and 3 of the fair value hierarchy in 2015 and 2016.
Assets measured at fair value based on Level 3:
Financial assets
designated at
fair value
through
profit or loss
Unquoted
investments
2016 2015
Group $’000 $’000
At 1 April 464,600 386,897
Total gains in profit or loss
Subscriptions/Contributions 5,348 69,217
Redemptions/Distributions
58,067 38,858
At 31 March
(77,620) (30,372)
450,395 464,600
Gains included in profit or loss 5,348 69,217
for the period (above) are presented as follows: 5,348 69,217
Total gains included in profit or loss
for the period
Total gains for the period included in
profit or loss for assets held at the
end of the reporting period
NANYANG TECHNOLOGICAL UNIVERSITY AND ITS SUBSIDIARIES 89