
Page 70 - Nanyang Technological University
P. 70
NOTES TO FINANCIAL STATEMENTS
(cont’d)
31 March 2016
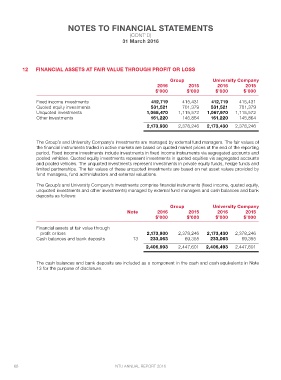
12 FINANCIAL ASSETS AT FAIR VALUE THROUGH PROFIT OR LOSS
Group University Company
2016 2015 2016 2015
$’000 $’000 $’000 $’000
Fixed income investments 412,719 415,431 412,719 415,431
Quoted equity investments 531,521 701,379 531,521 701,379
Unquoted investments 1,068,470 1,115,572 1,067,970 1,115,572
Other investments 161,220 145,864 161,220 145,864
2,173,930 2,378,246 2,173,430 2,378,246
The Group’s and University Company’s investments are managed by external fund managers. The fair values of
the financial instruments traded in active markets are based on quoted market prices at the end of the reporting
period. Fixed income investments include investments in fixed income instruments via segregated accounts and
pooled vehicles. Quoted equity investments represent investments in quoted equities via segregated accounts
and pooled vehicles. The unquoted investments represent investments in private equity funds, hedge funds and
limited partnerships. The fair values of these unquoted investments are based on net asset values provided by
fund managers, fund administrators and external valuations.
The Group’s and University Company’s investments comprise financial instruments (fixed income, quoted equity,
unquoted investments and other investments) managed by external fund managers and cash balances and bank
deposits as follows:
Group University Company
Note 2016 2015 2016 2015
$’000 $’000 $’000 $’000
Financial assets at fair value through
profit or loss 2,173,930 2,378,246 2,173,430 2,378,246
Cash balances and bank deposits 13 233,063 69,355 233,063 69,355
2,406,993 2,447,601 2,406,493 2,447,601
The cash balances and bank deposits are included as a component in the cash and cash equivalents in Note
13 for the purpose of disclosure.
68 NTU ANNUAL REPORT 2016