
Page 87 - Nanyang Technological University
P. 87
ON A RAPID RISE
NOTES TO
FINANCIAL STATEMENTS (CONT’D)
31 March 2015
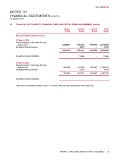
29 FINANCIAL INSTRUMENTS, FINANCIAL RISKS AND CAPITAL RISKS MANAGEMENT (cont’d)
Level 1 Level 2 Level 3 Total
$’000 $’000 $’000 $’000
Group and University Company
31 March 2015
Financial assets at fair value through
profit or loss 1,262,674 650,972 464,600 2,378,246
4,219 - 4,219
Derivative financial assets -
655,191 464,600 2,382,465
1,262,674
Derivative financial liabilities - 11,665 - 11,665
31 March 2014 962,099 447,863 386,897 1,796,859
Financial assets at fair value through - 5,919
profit or loss - 5,919
Derivative financial assets 386,897 1,802,778
962,099 453,782
- - - -
Derivative financial liabilities
There were no transfers between Level 1, 2 and 3 of the fair value hierarchy in 2014 and 2015.
NANYANG TECHNOLOGICAL UNIVERSITY AND ITS SUBSIDIARIES 85