Monte Carlo investigation of the
intrinsic mechanism of subpicosecond pulse generation by nonuniform illumination
Xing Zhou
School of Electrical and Electronic Engineering, Nanyang Technological
University, Singapore 2263, Republic of Singapore
Sotiris Alexandrou and Thomas Y. Hsiang
Department of Electrical Engineering and Laboratory for Laser Energetics,
University of Rochester, Rochester, New York 14627
Figures
Fig. 1 | Fig. 2 | Fig.
3 | Fig. 4 | Fig. 5 | Fig.
6 | Fig. 7 | Fig. 8 | Fig.
9
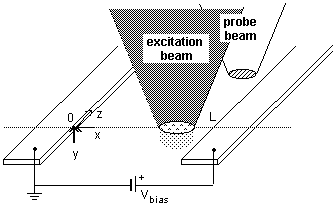 Fig. 1 Sketch of sample and measurement setup for nonuniform gap
illumination. Simulation is along x at y = z = 0.
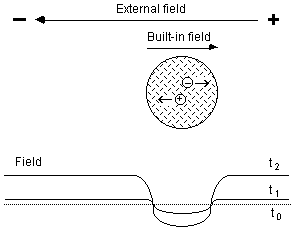 Fig. 2 Schematic illustration for the physical mechanism of nonuniform
gap illumination.
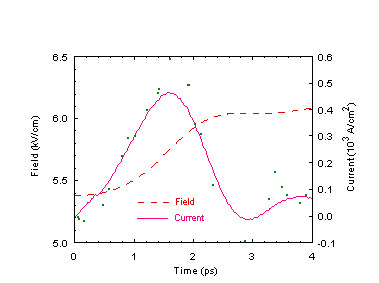 Fig. 3 Left axis: Field transient sampled across the gap
(unilluminated area); Right axis: Displacement current that corresponds
to the generated electrical pulse. The dotted field curve is the simulation
data; the broken line is after smoothing. The dotted current curve is obtained
from the original field data; the solid line is from the smoothed field.
All based on simulation I with 1016 cm-3 excitation.
Positive field direction is defined in the +x direction.
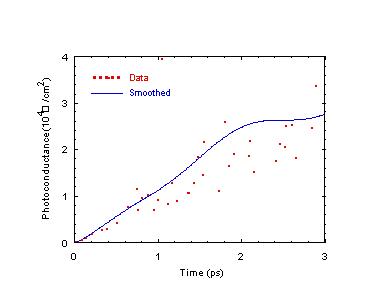 Fig. 4 Photoconductance transient after optical excitation calculated
from the MC simulation [Eq. (6)].
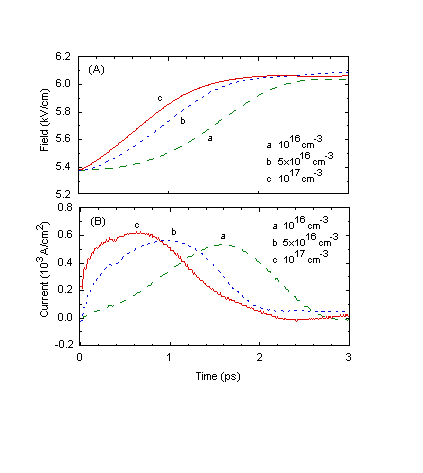 Fig. 5 Light-intensity dependence of the (A) field transient and
(B) displacement current (Simulation I).
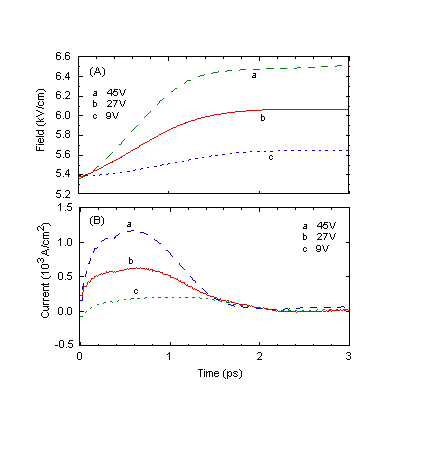 Fig. 6 Bias-voltage dependence of the (A) field transient and (B)
displacement current (Simulation II). In (A), curve a is shifted
down by 3.6 kV/cm and curve c is shifted up by 3.6 kV/cm for better
resolution.
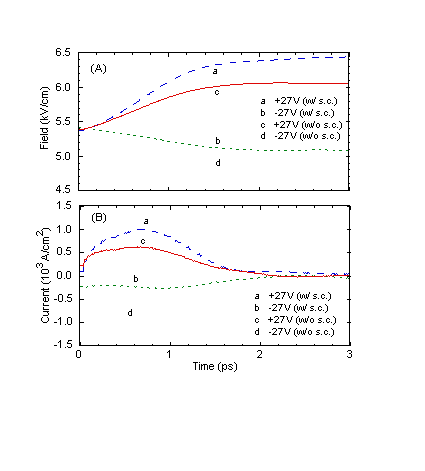 Fig. 7 Bias-polarity dependence and surface-charge effect for the
(A) field transient and (B) displacement current (Simulation III). In (A),
curve a is shifted down by 2.8 kV/cm, curve b is shifted
up by 8 kV/cm, and curve d is shifted up by 10.8 kV/cm.
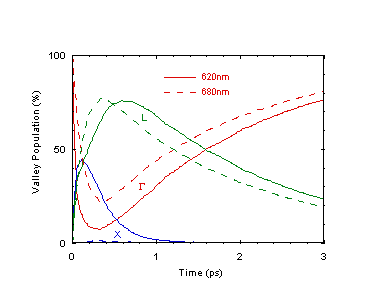 Fig. 8 Valley populations for l = 680
and 620-nm excitations.
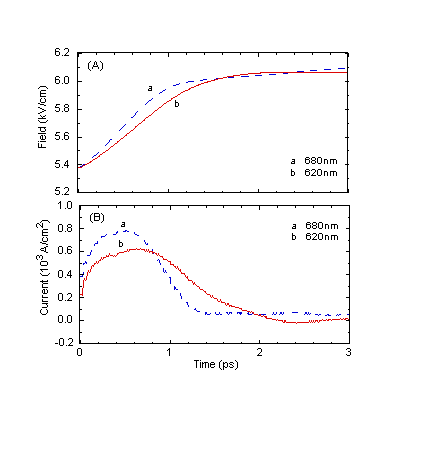 Fig. 9 Excitation-wavelength dependence of the (A) field transient
and (B) displacement current (Simulation IV).


