Monte Carlo determination of femtosecond
dynamics of hot-carrier relaxation and scattering processes in bulk GaAs
Xing Zhou and Thomas Y. Hsiang
Department of Electrical Engineering and Laboratory for Laser Energetics,
University of Rochester, Rochester, New York 14627
Figures
Fig. 1 | Fig. 2 | Fig.
3 | Fig. 4 | Fig. 5 | Fig.
6 | Fig. 7 | Fig. 8 | Fig.
9 | Fig. 10
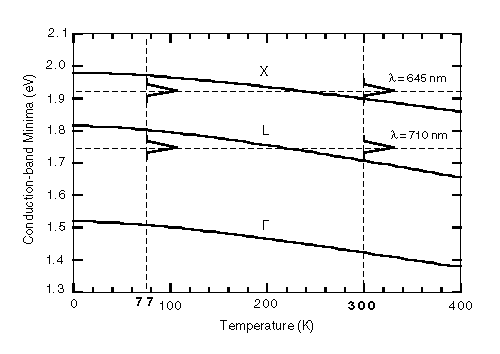 Fig. 1 Variation of conduction-band minima of GaAs with temperature.
The power spectrum of the two laser sources are schematically shown at
300 and 77 K.
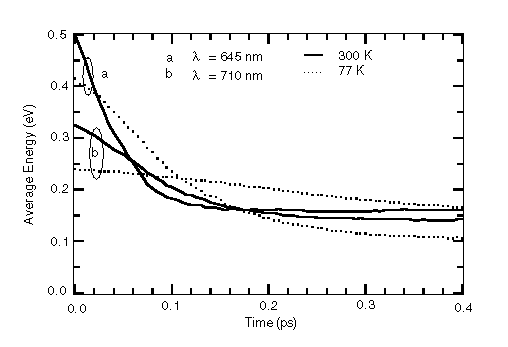 Fig. 2 The time evolution of average energy in all valleys for the
l = 645 nm (curves a) and the
l = 710 nm (curves b) excitations
at 300 K (solid lines) and 77 K (dotted lines).
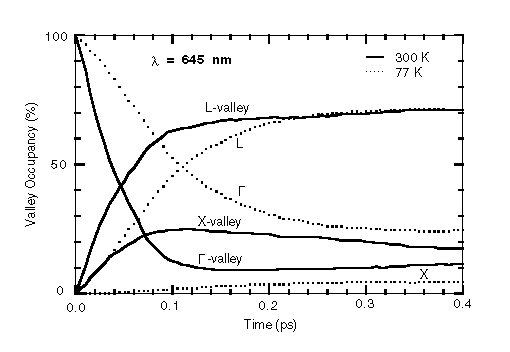 Fig. 3 Valley occupancies for the l
= 645 nm excitation at 300 K (solid lines) and 77 K (dotted lines).
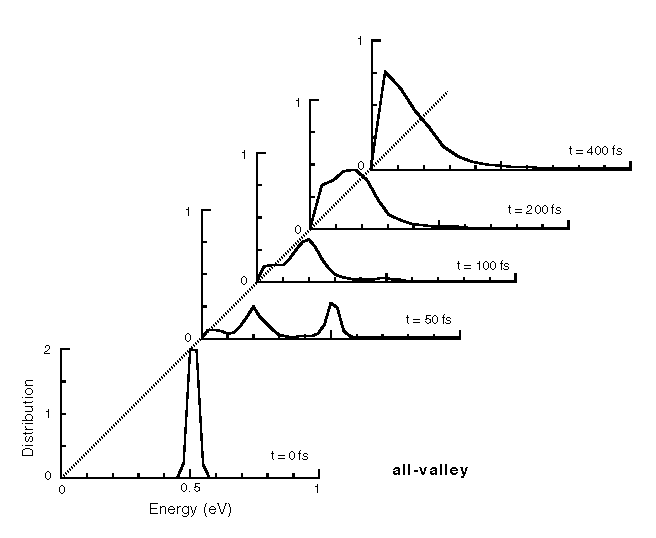 Fig. 4 Electron energy distributions in all valleys for the l
= 645 nm excitation at 300 K, sampled at 0, 50, 100, 200, and 400 fs.
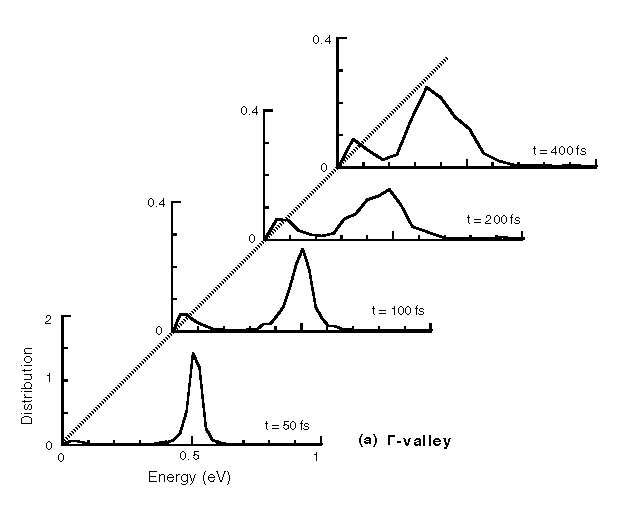
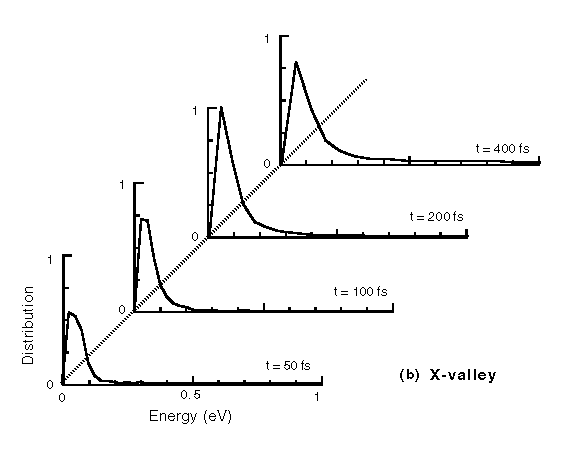
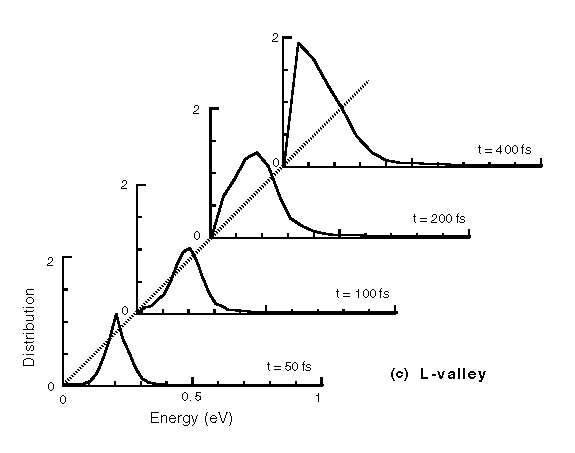 Fig. 5 Electron energy distributions in the (a) G
valley, (b) X valley, and (c) L valley for the l
= 645 nm excitation at 300 K, sampled at 50, 100, 200, and 400 fs.
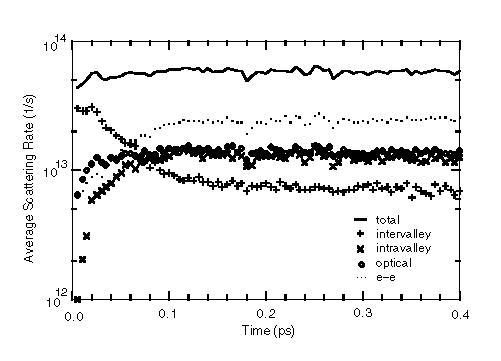 Fig. 6 Average scattering rate due to each mechanism indicated as
a function of time for the l = 645 nm
excitation at 300 K.
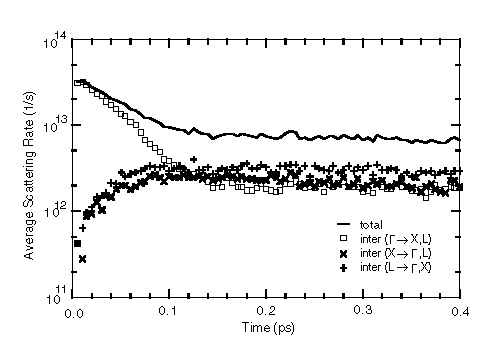 Fig. 7 Average scattering rate vs time for the l
= 645 nm excitation at 300 K with all but intervalley scattering mechanisms
deliberately disabled. Squares denote intervalley scattering out of the
G valley; crosses denote intervalley scattering
out of the X valley; plus signs denote intervalley scattering out
of the L valley. The solid line is the sum of the above three scattering
rates which is equivalent to the plus signs in Fig. 6.
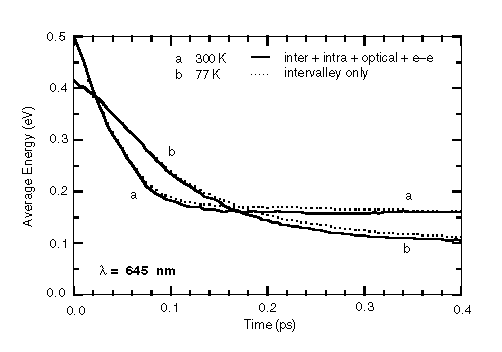 Fig. 8 Average energy in all valleys vs time for the l
= 645 nm excitation at 300 K (curves a) and 77 K (curves b).
The solid lines are obtained with all operative scattering mechanisms and
are compared to the dotted lines with only intervalley scattering present.
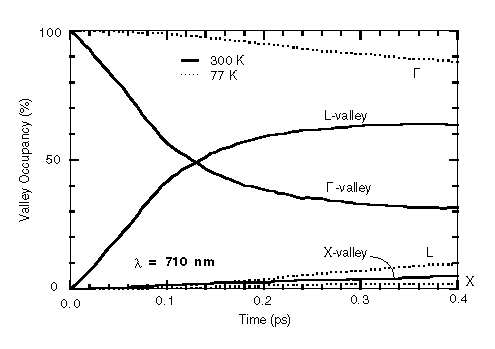 Fig. 9 Valley occupancies for the l
= 710 nm excitation at 300 K (solid lines) and 77 K (dotted lines).
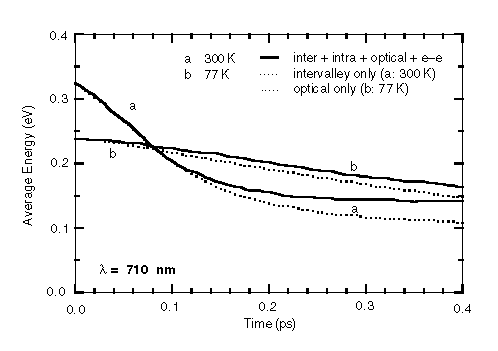 Fig. 10 Average energy in all valleys vs time for the l
= 710 nm excitation at 300 K (curves a) and 77 K (curves b).
The solid lines are obtained with all operative scattering mechanisms and
are compared to the dotted lines with only one scattering mechanism present.


