Monte Carlo study of photogenerated
carrier transport in GaAs surface space-charge fields
Xing Zhou and Thomas Y. Hsiang
Department of Electrical Engineering and Laboratory for Laser Energetics.
University of Rochester, Rochester, New York 14627
R. J. Dwayne Miller
Department of Chemistry and Institute of Optics, University of Rochester,
Rochester, New York 14627
Figures
Fig. 1 | Fig. 2 | Fig.
3 | Fig. 4 | Fig. 5 | Fig.
6 | Fig. 7 | Fig. 8 | Fig.
9 | Fig. 10 | Fig. 11 |
Fig. 12 | Fig. 13 | Fig.
14 | Fig. 15 | Fig. 16
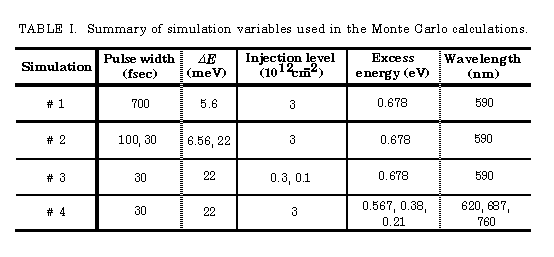
| Tab. 1
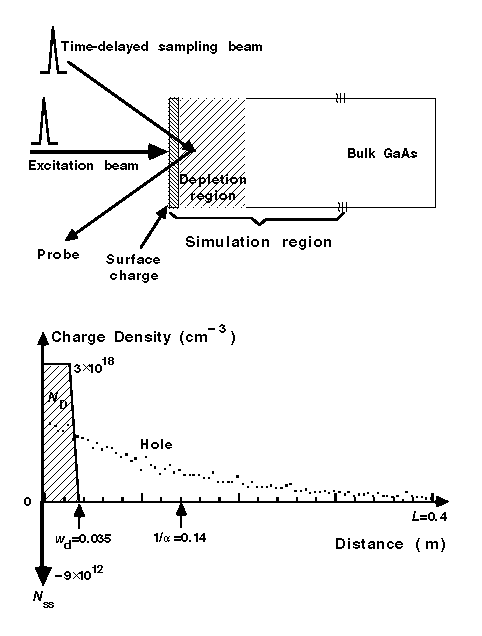 Fig. 1 Top: Sketch of sample and measurement setup. Bottom: Region
of simulation and initial charge distributions (the dotted line is the
hole density after carrier injection).
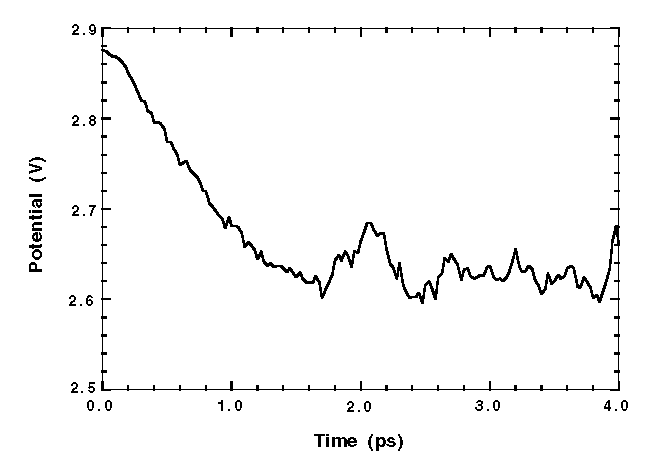 Fig. 2 Potential drop as a function of time for the 700-fs pulse.
 (a)
(a)
 (b)
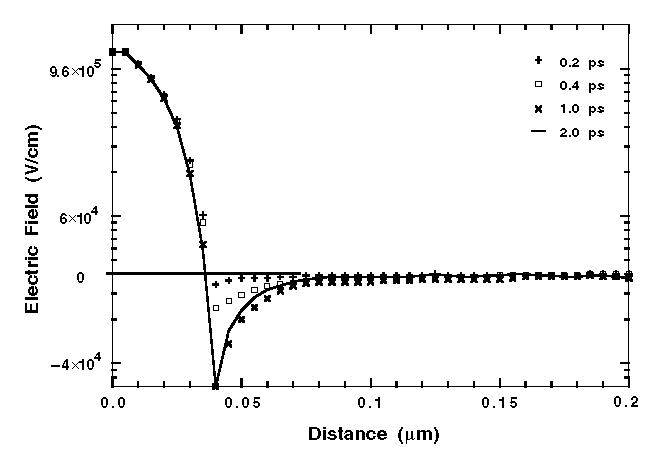
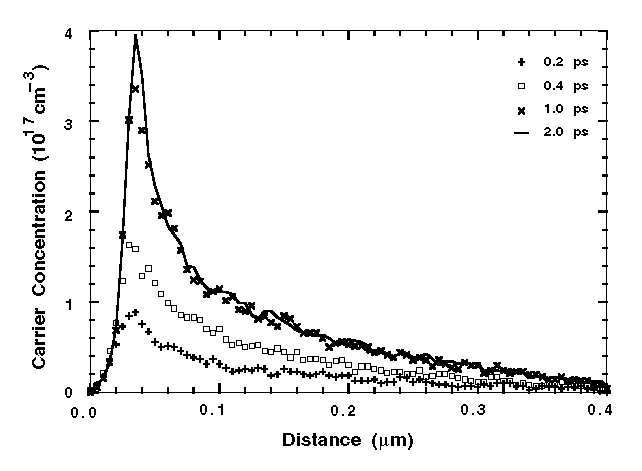
Fig. 3 (a) Field distribution and (b) electron concentration sampled
at 0.2, 0.4, 1.0, and 2.0 ps for the 700-fs pulse.
 (a)
(a)
 (b)
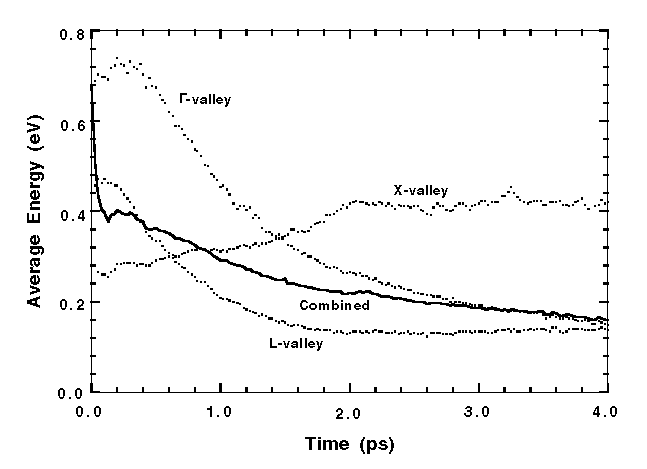
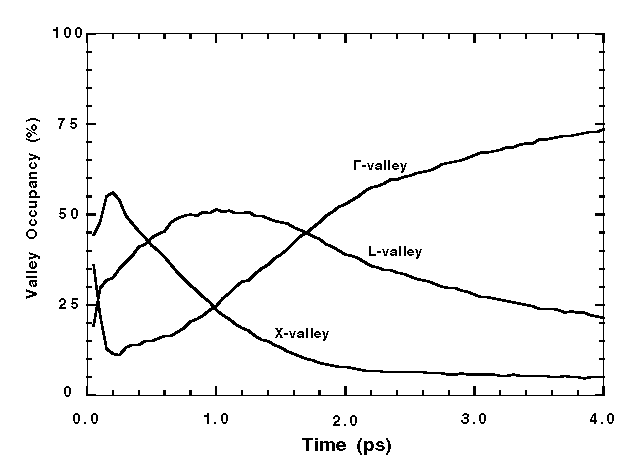
Fig. 4 (a) Electron average energy in each separate valley and the
combined valley and (b) valley occupancy for the 700-fs pulse.
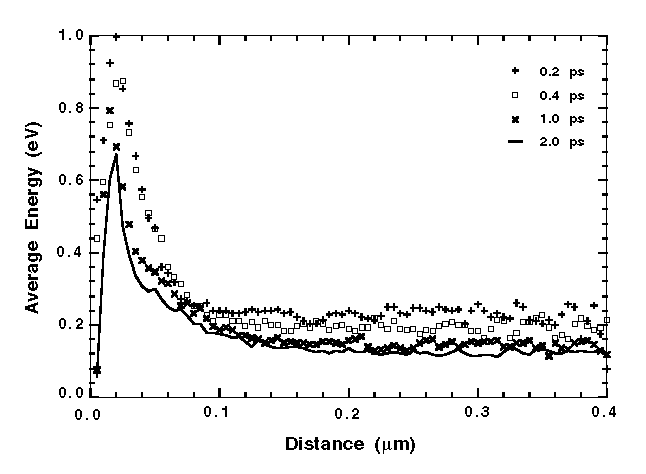 Fig. 5 Electron average energy in the combined valley vs distance
for the 700-fs pulse sampled at 0.2, 0.4, 1.0, and 2.0 ps.
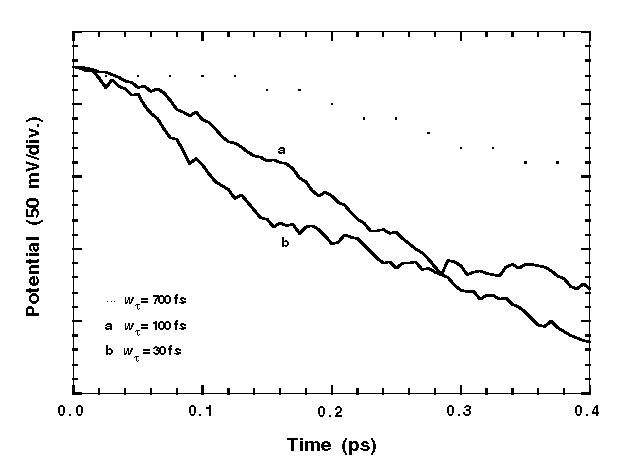 Fig. 6 Pulse width dependence: potential vs time for the 100- and
30-fs pulses, and compared with the 700-fs pulse.
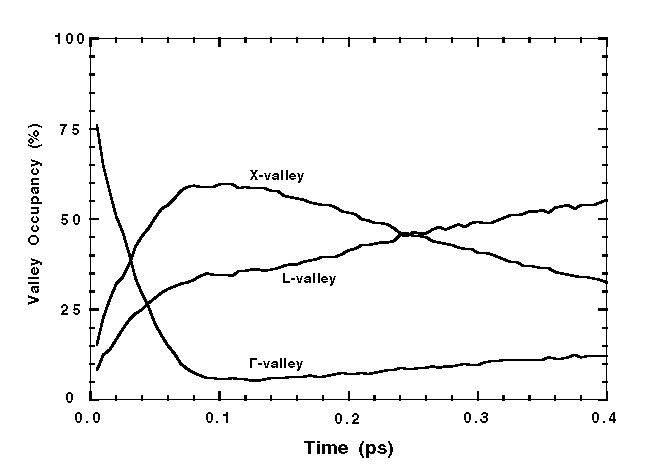 Fig. 7 Valley occupancy for the 30-fs pulse.
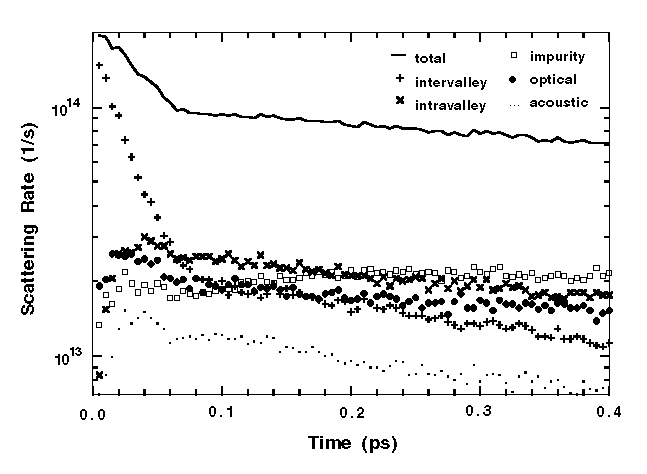 Fig. 8 Scattering rate due to each mechanism as a function of time
for the 30-fs pulse.
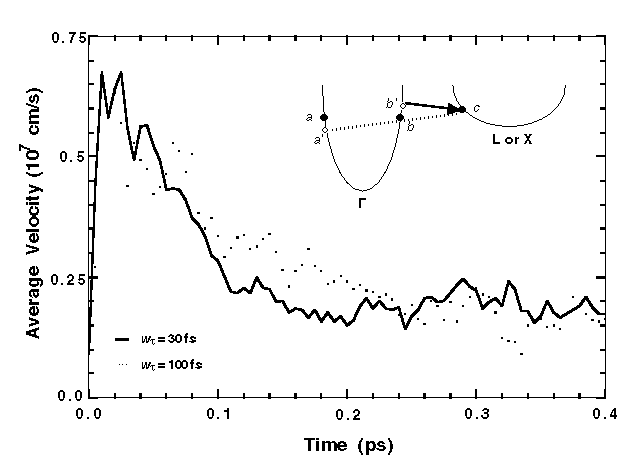 Fig. 9 Velocity overshoot: average velocity in the combined valley
for the 30- and 100-fs pulses. The effect of intervalley transfer is schematically
illustrated in the inset.
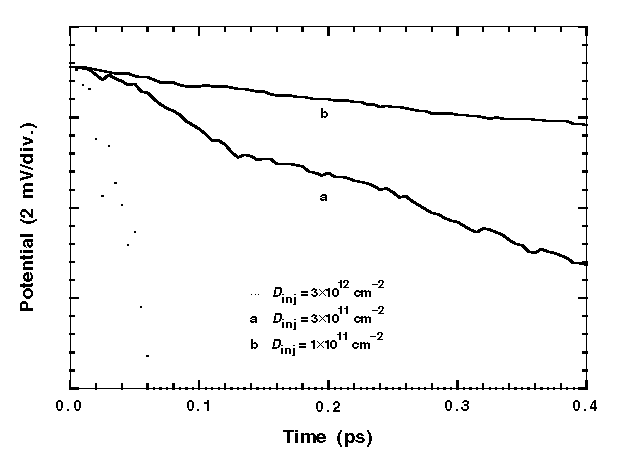 Fig. 10 Injection level dependence: potential vs time at two low-level
injections and compared with the high-level injec-tion case.
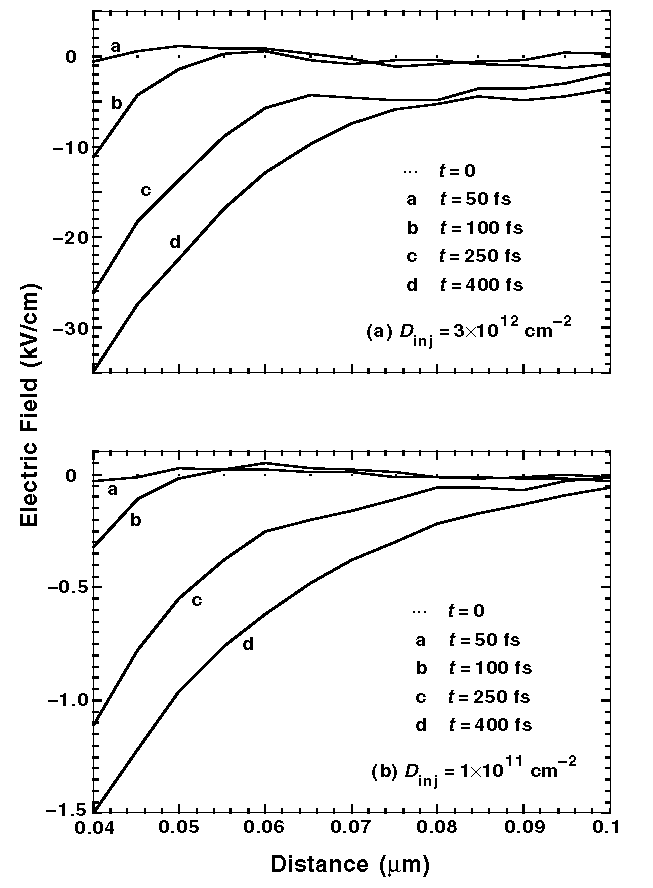 Fig. 11 Field changes in the retarding field region for (a) high-level
injection and (b) low-level injection sampled at 50, 100, 250, and 400
fs.
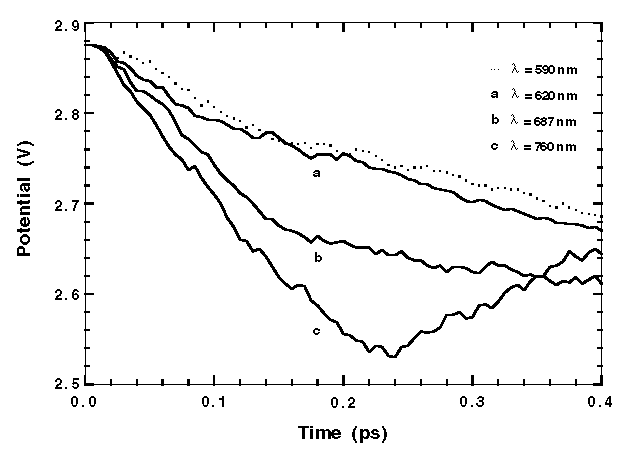 Fig. 12 Excitation energy dependence: potential vs time at different
excitation energies.
 (a)
(a)
 (b)
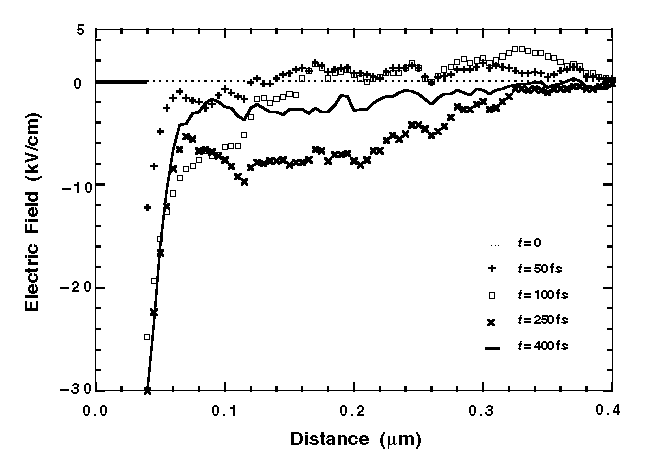
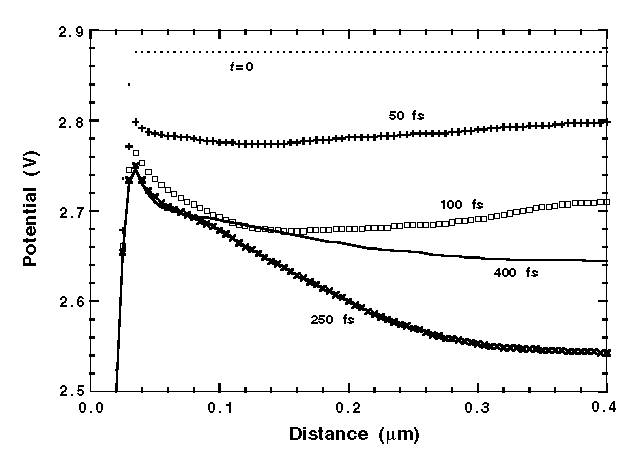
Fig. 13 (a) Field distributions and (b) potential profiles in space
sampled at 50, 100, 250, and 400 fs for high-energy excitation, showing
the effect of carrier redistribution in the bulk.
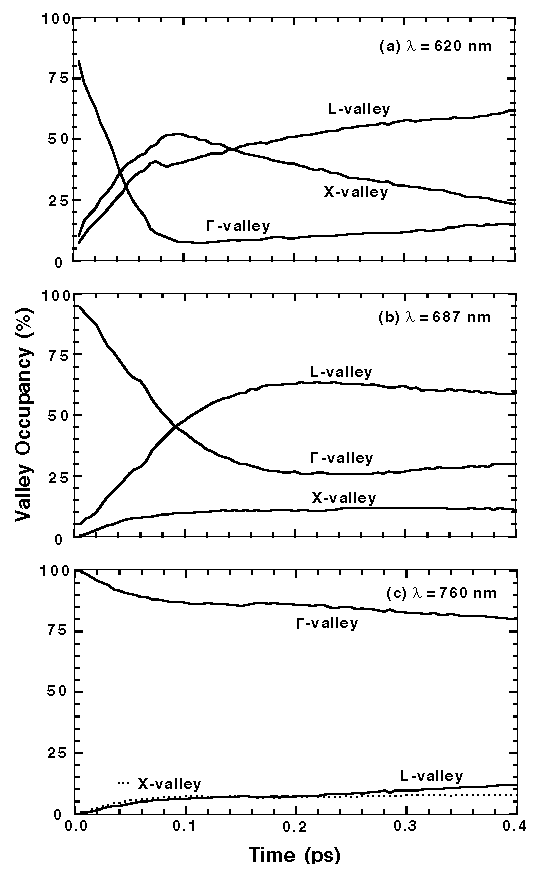 Fig. 14 Valley occupancy at different levels of excitation: (a)
l = 620 nm, (b) l =
687 nm, and (c) l = 760 nm, and
com-pared with the l = 590-nm excitation.
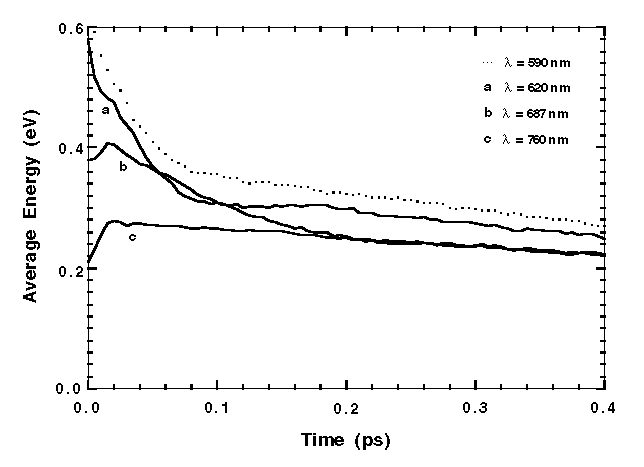 Fig. 15 Energy relaxation at different excitation energies.
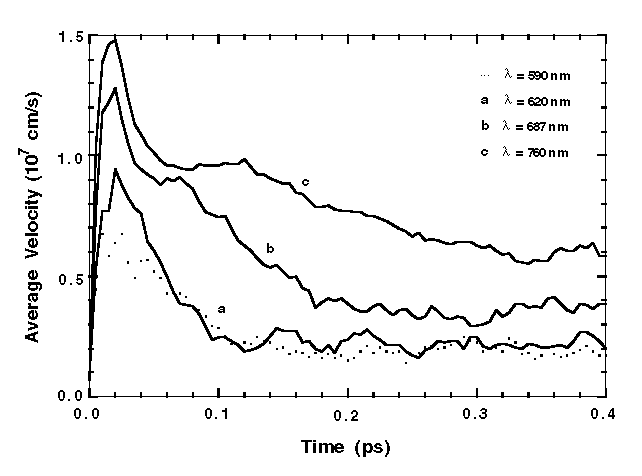 Fig. 16 Velocity overshoot at different excitation energies.


 (a)
(a) (b)
(b) (a)
(a) (b)
(b)


 (a)
(a) (b)
(b)


