Fig. 1 | Fig. 2 | Fig. 3 | Fig. 4 | Fig. 5 | Fig. 6 | Fig. 7 | Fig. 8
Xing Zhou, Senior Member, IEEE, Khee Yong Lim, Student Member, IEEE, and David Lim
Fig. 1 | Fig. 2 | Fig. 3 | Fig. 4 | Fig. 5 | Fig. 6 | Fig. 7 | Fig. 8
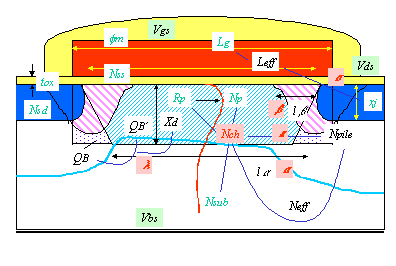
Fig. 1 Macromodel view of an nMOS transistor. All the major physical and empirical parameters of the proposed model are depicted and explained in the paper.
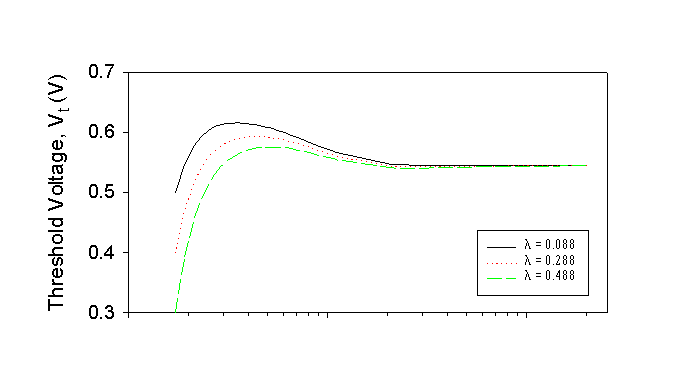
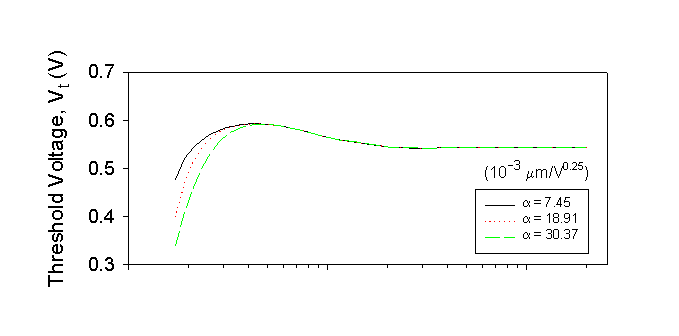
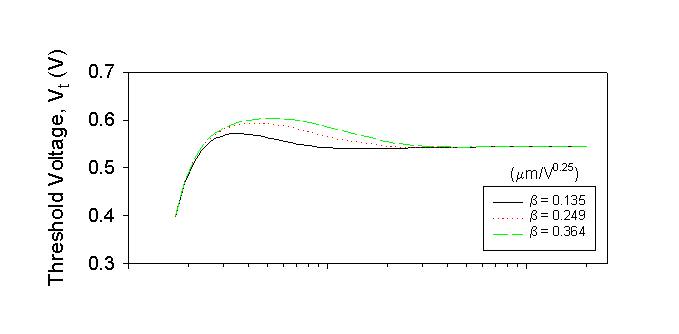
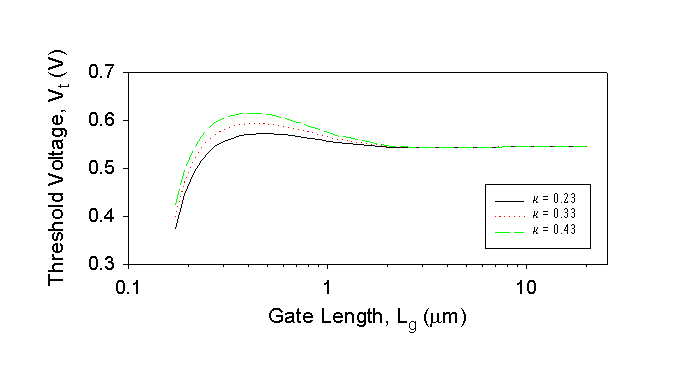
Fig. 2 The compact Vt model behavior. One fitting parameter is changed at a time with others taking their nominal values (dotted lines).
Fig. 3 Parameter-extraction procedure, with four measurements and four steps as explained in the paper.
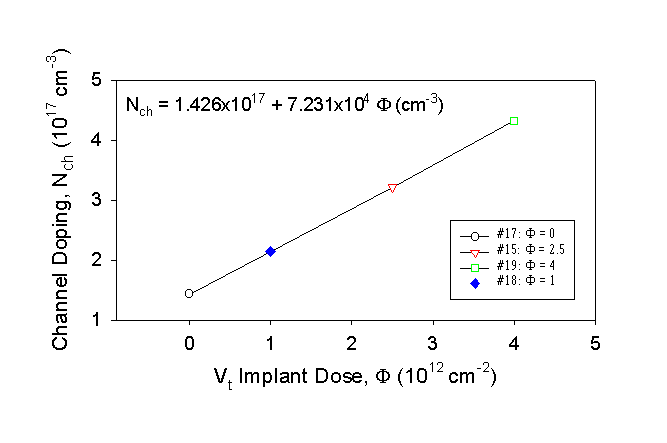
Fig. 4 Experimental correlation of the model parameter Nch to Vt implant dose F. The full set of fitting parameters is extracted from wafer #15 data. The empirical correlation Nch F in (a) is found from long-channel data of wafers #17 and #19. Prediction of wafer #18 in (b) is made by the compact model with F as input.
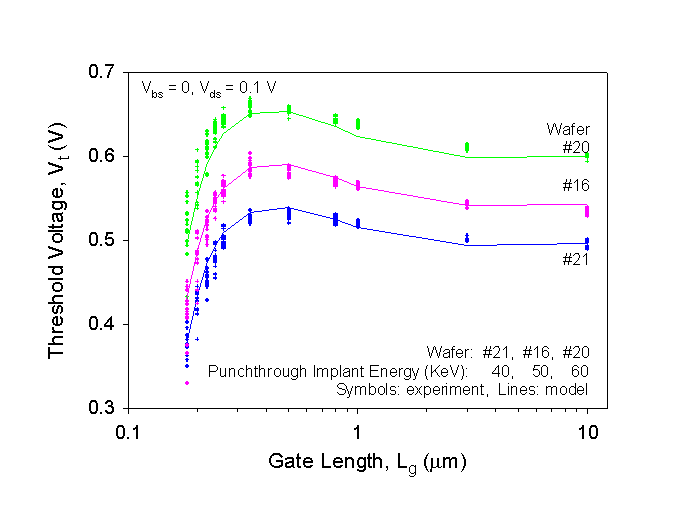
Fig. 5 Experimental correlation of the model parameter Nch to punchthrough implant energy E. The same set of fitting parameters from wafer #15 data is used. The empirical correlation Nch E in (a) is found from long-channel data of wafers #20 and #21. Prediction of wafer #16 in (b) is made by the compact model with E as input.
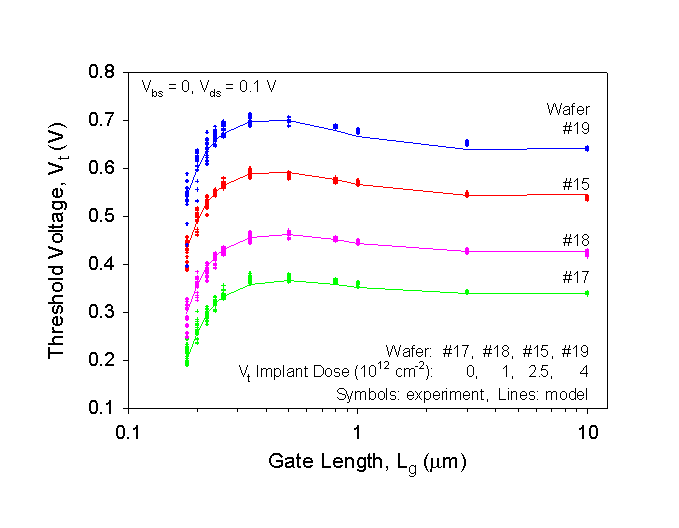
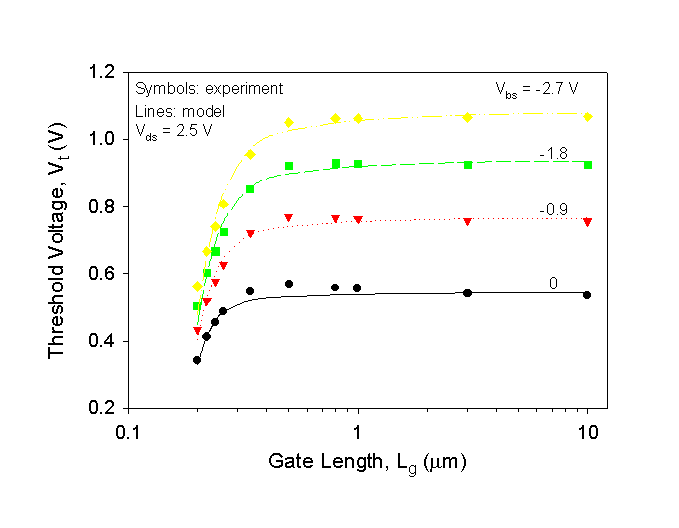
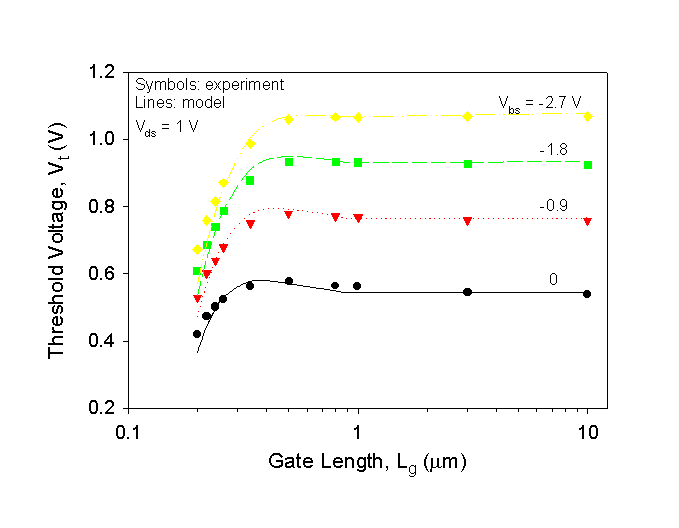
Fig. 6 Results of the compact Vt model (lines) compared with the experimental data (symbols), with full range of gate length, body and drain biases.
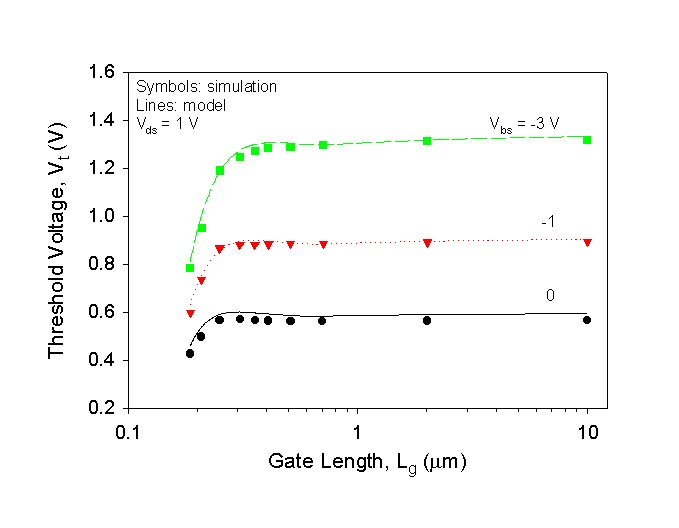
Fig. 7 Prediction of the compact Vt model (lines) on the simulated data (symbols) at an intermediate drain bias. The fitting parameters are extracted from the simulated data similar to Figs. 6(a) and 6(b) (not shown).
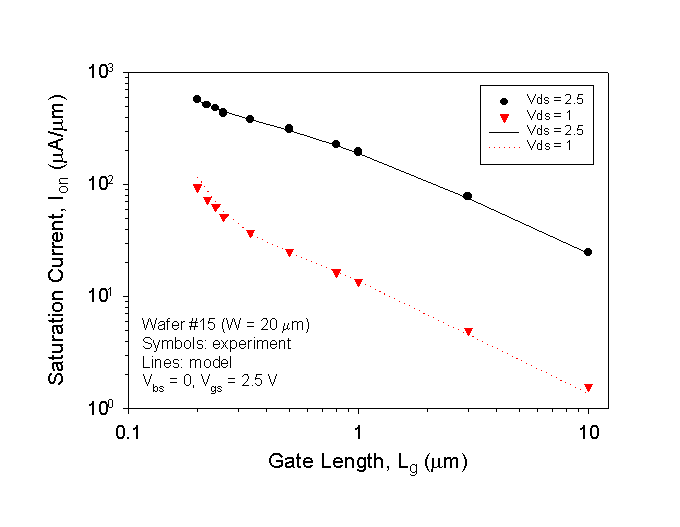
Fig. 8 Preliminary results of the saturation-current model using
the developed Vt model. The measured Ion at Vgs
= Vds = 2.5 V (circles) is used to extract the parameters
for mobility and series resistance. The dotted line is predicted
by the model at Vgs = Vds = 1 V compared
to the experimental data (triangles).
 (a)
(a)
 (b)
(b)
 (c)
(c)
 (d)
(d)
 (e)
(e)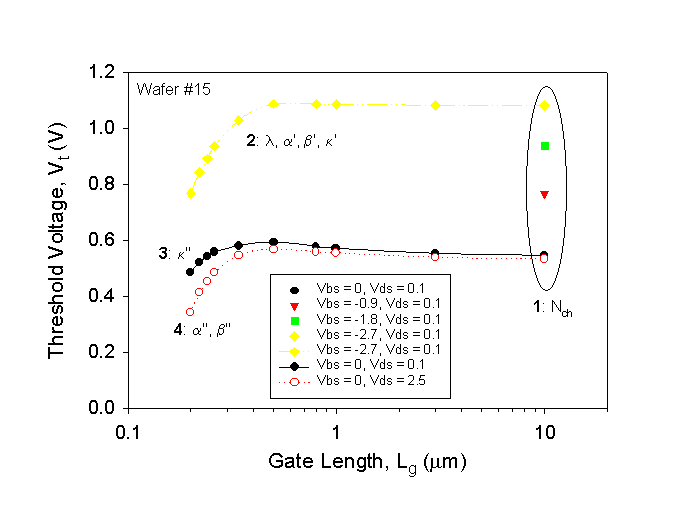
 (a)
(a)
 (b)
(b)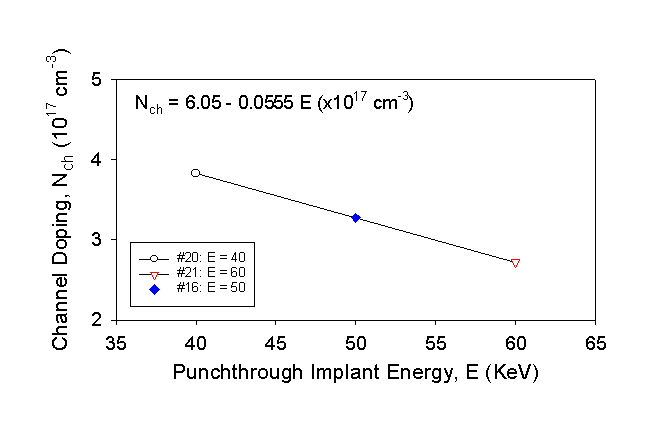 (a)
(a)
 (b)
(b)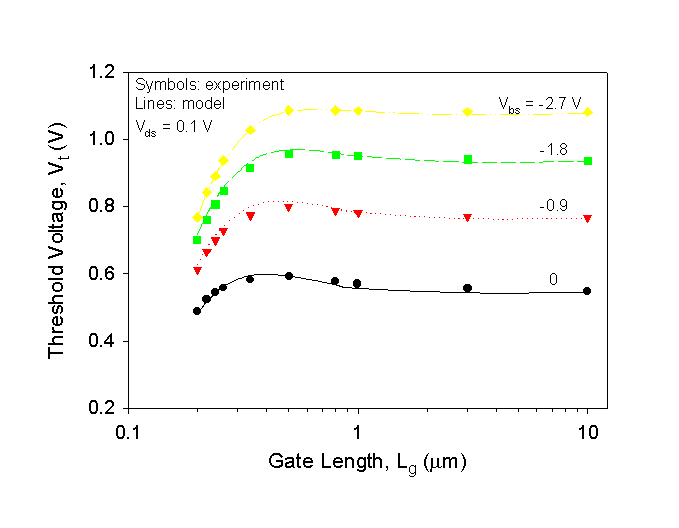 (a)
(a)
 (b)
(b)
 (c)
(c)