Regional Monte
Carlo Modeling of Electron Transport and Transit-Time Estimation in Graded-Base
HBT's
Xing Zhou, Member,
IEEE
Figures
Fig. 1 | Fig. 2 | Fig.
3 | Fig. 4 | Fig. 5 | Fig.
6 | Fig. 7 | Fig. 8 | Fig.
9 | Fig. 10 | Fig. 11 |
Fig. 12
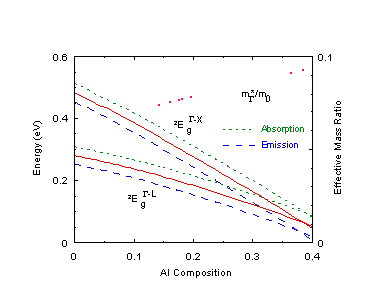 Fig. 1 Left axis: Threshold energy for intervalley scatterings
between G and L/X valleys (solid
lines) in AlxGa1-xAs as a function
of Al composition. Scattering due to phonon emission (dashed lines) and
absorption (broken lines) are also shown with composition-dependent phonon
energies. Right axis: G-valley effective-mass
ratio in AlxGa1-xAs (dotted line).
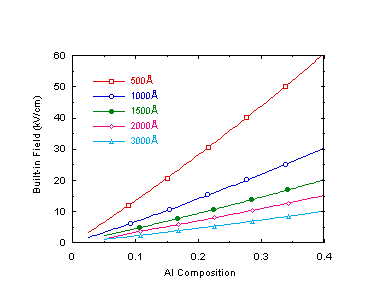 Fig. 2 Built-in field versus composition at various base widths
using the quasi-linear relationship (2).
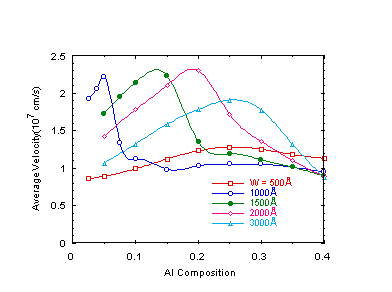 Fig. 3 Average velocity versus composition at various base widths.
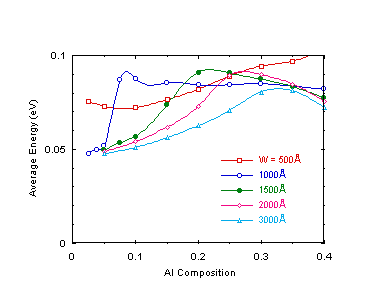 Fig. 4 Average energy versus composition at various base widths.
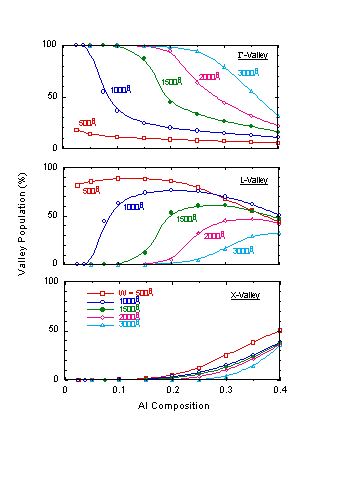 Fig. 5 Valley population versus composition at various base widths.
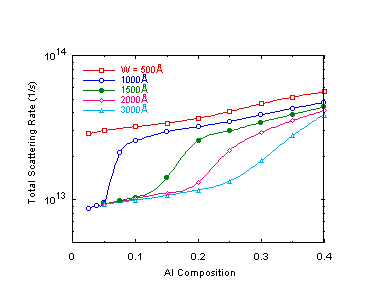 Fig. 6 Average total scattering rate versus composition at various
base widths.
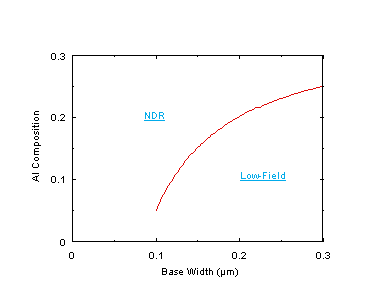 Fig. 7 Transit time optimization curve: base width-composition combinations
on which peak average velocities occur. Above this curve NDR and high-field
effect are dominant; below this curve transport is in the low-field (Ohmic)
regime; on this curve, optimum base transit times are expected.
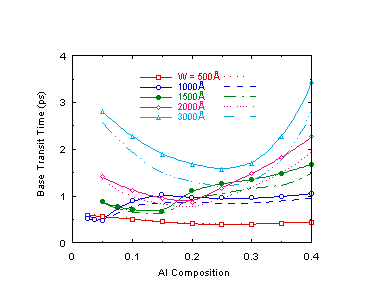 Fig. 8 Base transit times versus composition at various base widths,
using (7) (solid lines) and (8) (dotted lines).
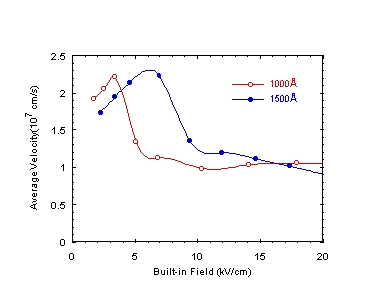 Fig. 9 Average velocity versus built-in field for W = 1000Å
and 1500Å. The field is mapped from composition using (2) (see Fig.
2).
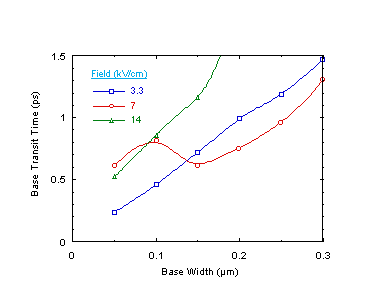 Fig. 10 Base transit time versus base width at three constant fields
(i.e., both W and x are varied but the slope of conduction
band is kept constant).
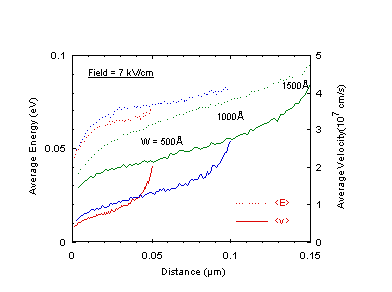 Fig. 11 Average energy (---) and velocity (—) versus distance at
a constant built-in field of 7 kV/cm. The end of each curve indicates the
corresponding base width.
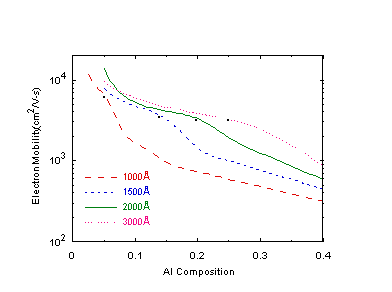 Fig. 12 Mobility versus composition at various base widths. The
dots indicate where the peak velocities occur.


